Interconnection capacity, on the map
GIPS puts TARA's point-of-interconnection injection and withdrawal capacity results on an interactive map — meeting FERC Order 2023 heat-map requirements and showing interconnection customers where the grid can take new load, before they file.
Built for heat maps. Grown well beyond them.
GIPS began as a way to satisfy FERC Order 2023. Today it is a full interactive review environment for POI capacity results computed by TARA's Worst Cluster TrLim or FCITC.
Hosting capabilities
Both generation and load hosting capabilities.
Multi-scenario review
Present multiple scenarios across study years, models, and calculation assumptions — side by side.
User-defined MW injection
Enter an injection or withdrawal amount and interactively report the resulting constraint flows.
POI injection & withdrawal capacity
Show available capacity at every point of interconnection, computed by Worst Cluster TrLim or FCITC.
Competing harmers on the map
Report competing harmer generators, including their locations, for any selected constraint.
Limiting constraints, located
Display each limiting constraint on the map — as a line or a filled circle by type and location.
Mitigation cost estimates
Estimate the cost of mitigating a constraint before an interconnection request is filed.
Capacity surface at low zoom
A coloured surface interpolated from the loaded scenario, answering where there is headroom across the whole territory — then handing off to clusters and individual markers as the reader zooms in.
Your own data layers
Overlay an interconnection queue, a retirement list, or siting candidates — imported from a CSV in GIPS Desktop and drawn beside the buses, constraints, and harmers.
Aerial imagery & power infrastructure
Switch the basemap between vector streets and Esri satellite imagery, and draw transmission lines, substations, plants, and turbines with an eight-band voltage ramp.
Published methodology
A panel your administrators write in GIPS Desktop, telling readers how the numbers were produced.
Runs on locked-down networks
Point GIPS Desktop at your own copies of the map styles when the network cannot reach PowerGEM — an administrator option kept in admin.json and never exported to readers.
What's new in v4.0
A new map engine, a territory-scale read on capacity, room for your own data — and, in v4.0.2, administrator options for installations behind a firewall. Existing deployments load unchanged; three changes need a decision first.
Capacity surface
Where is there capacity? Answered at territory scale, coloured by your own ranges. Click it and the POI behind the colour is a link.
Data layers
Your interconnection queue on the map, in the legend, and in a filterable table.
Aerial basemap
Esri World Imagery, with street and place names kept on top of it.
Power infrastructure
Lines, substations, plants, and turbines, with a voltage colour ramp in the legend.
Light & dark themes
Light, dark, or follow the operating system. The map, tables, and logo follow.
Methodology panel
Written in Desktop, read by every Lite and Pro user.
Administrator options
v4.0.2Self-hosted map styles for installations that cannot reach the internet, kept in admin.json and never exported.
A new map engine
MapLibre GL, drawing vector tiles PowerGEM serves. Sharp at any zoom, and no dependency on OpenStreetMap’s tile servers.
And also, between v3.1.6 and v4.0.2
258 commits, March to August 2026Loaded the wrong file, or named a scenario badly? Fix it in GIPS Desktop beside the scenario picker instead of starting over.
One click clears the POI, Constraints, Harmers and data-layer tables together.
When every POI in a cluster falls in the same range the bubble takes that colour; only a mixed cluster draws neutral blue.
Show one constraint of a POI on the map and every constraint of the next POI you pick is shown too. Harmers do the same.
12 of 340 constraints in the heading, and a third click on a column clears the sort. Truncated cells show their full text on hover.
A maximum zoom set in GIPS Desktop is honoured by GIPS Lite and Pro, so readers cannot zoom past the detail your data supports.
Show Dfax as a percentage rather than a decimal, and give the contingency base case a name of your own, from configuration.json.
Built on React 19 and Vite 8, gips.exe is roughly a third of its v3 size — the last step alone took it from 11.2 MB to 7.4 MB by dropping a development data file it never read.
GIPS Desktop reads the GIPS_HEATMAP option from the same licensed-option list TARA uses — no separate provisioning step — and gips.exe is code-signed, so SmartScreen and publisher-based allowlisting recognise it.
Three editions. One engine.
Every edition presents the same TARA results. Choose by who needs access — the public, your planners, or the engineer building the dataset.
FERC 2023 Heat Maps In production
Click a logo to open the live heat map.





See it running on real data
Two live demos using sample data from the Ohio Valley. No login, no install.
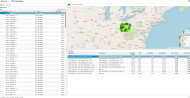
Ohio Valley
The public heat-map experience: the capacity surface, POI and constraint tables, a generator data layer, and user-entered injection amounts.
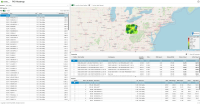
Ohio Valley (Pro)
Adds a harmers grid for the selected constraint, with constraints drawn on the map by type and location.
Additional services
Hosting
PowerGEM can host your heatmap for you.
No-cost demo
Contact PowerGEM for a no-cost demo using your grid.
Free training
Free training on how to get results from TARA into GIPS, in less than 3 hours.
Put your capacity results on the map
Five grid operators already publish with GIPS. Talk to our team about hosting yours.
Contact us